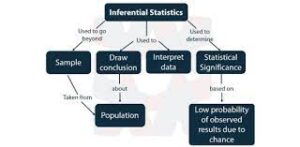
Statistical inference helps professionals across a range of industries analyze data and make conclusions about populations. With the information statistical inference can provide, you can evaluate the probability of specific outcomes. There are several approaches to testing statistical inference when calculating probable results, and you may benefit from learning about your options. In this article, we explore what inferential statistics are, how this branch of statistics works, and what types of statistical inferences you can make when performing data analysis.
Recommended
What is inferential statistics?
Inferential statistics comprise a branch of statistics that builds models to compare data samples to samples from previous research. An inferential analysis uses these models to make general assumptions about a sample that can support specific events, traits or behaviors in larger populations. Many statisticians, researchers, and analysts rely on statistical inferences to measure probabilities and the likelihood of outcomes occurring based on historical data about a particular group.
How do inferential statistics work?
Statistical inference measures data from a sample and makes conclusions about the larger population based on analysis of the sample. When applying inferential analysis, it’s important to have a high level of confidence that the sample you test reflects the population accurately. This confidence level represents the confidence interval, which is a percentage that shows how likely it is the sample is representative of an entire population. To ensure a viable sample for analysis, it’s important statistical inferences follow a process that:
-
Defines a population
-
Selects a sample that represents the population
-
Analyzes the sampling error
Selecting a sample from a population occurs randomly, where analysis determines descriptive metrics, such as the mean and standard deviation. When inferring data from the sample, you can use statistical tools to determine the margin of error, confidence interval, and distributions of population samples.
9 types of Statistical Inference

The following types of statistical inference are often common when performing data analysis:
1. Regression analysis
Regression analysis encompasses testing methods that measure the relationship between dependent and independent variables. When using regression analysis, you measure variable relationships based on historical data and past observations about the sample group. In simple regression analysis, you measure the correlation between a single dependent variable and a single independent variable. In multiple regression analysis, there is more than one independent variable that you evaluate the dependent variable against. When forming a linear regression model, this analysis shows up on a graph, where the sample data clusters around the line you create with your analysis.
2. Hypothesis testing
You can use hypothesis testing to evaluate assumptions and generalizations you make about a population by assessing various parameters on sample groups. Using data from the descriptive analysis, you can evaluate the likelihood of hypotheses being true for an entire population based on your assessment of the sample group. One important aspect of hypothesis testing is that it assesses a null hypothesis, which you can either reject or accept, depending on the nature of your analysis.
3. Confidence interval
Confidence intervals are essential to establishing measurable parameters when analyzing statistical inferences. The confidence interval (CI) represents the probability of these parameters showing up within a distinct range of estimates. Statisticians and data analysts often establish a confidence interval between 90% and 99%, as plausibility must be less than 100%. Typically, a 95% confidence interval is desirable when evaluating inferential data in statistics.
4. Mean comparison
Inferential analysis can also encompass mean comparisons, which show whether two separate data samples have similar means. One common application to perform a mean comparison is the t-test, which evaluates the mean of a variable in one sample to the same variable mean in one or more separate samples. The t-test determines whether the sample mean appears below or above zero.
5. Distributions
Distribution refers to the functions that show all possible intervals or values for a data sample. The distribution of data in a statistical analysis typically occurs from the smallest values to the largest values and can show you the frequency and degree of distribution. This metric is important to inferential analysis because it represents how far spread out your data values are for your sample group.
6. Statistical significance
The significance of statistical inference is essential in determining how strong the relationship is between dependent and independent variables. By measuring the significance of the means of two or more sample groups, you can identify whether the relationship is correlative or causative in nature. The statistical significance typically results from performing t-tests to compare sample means.
READ ALSO: BEST ONLINE ENGINEERING DEGREES
7. Binomial theorem
The binomial theorem refers to probability testing for two distinct outcomes. You can apply the binomial theorem to your analysis when evaluating the probability of one of two outcomes taking place within a sample set of data. For instance, measuring the success or failure of winning the lottery can be a suitable application of the binomial theorem for inferential analysis in statistics.
8. Central limit theorem
The central limit theorem represents independent random variables whose sums tend toward normal distribution, even if the original variables aren’t in normal distributions. This principle is important in inferential analysis, as it establishes a probability that statistical parameters that apply to normal distributions can also apply to sample data without normal distributions. When looking at the central limits of probable distributions, you can also estimate probable percentiles for your sample data. This helps determine how large your sample needs to be to ensure a substantial confidence interval, such as 95%.
9. Pearson correlation
The Pearson correlation refers to the correlation coefficient and measures to what extent data values appear along a regression line. When evaluating statistical inference using the correlation coefficient, you can estimate whether variable relationships exhibit a correlation. Depending on your analysis, you may also use this value to determine the strength of the correlation and the probability that the correlation is actually a causative relationship.
I hope you find this article helpful.